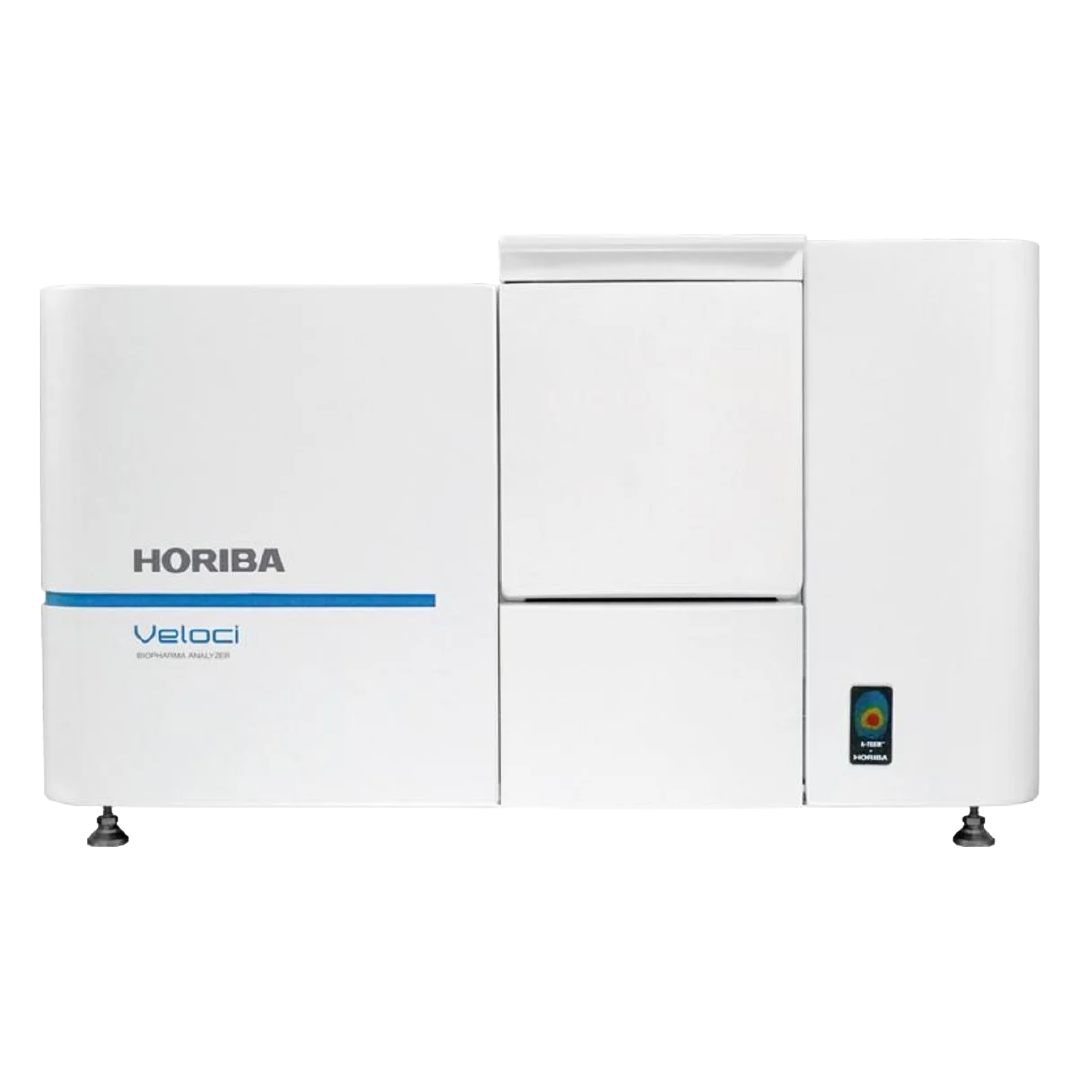
Read More Transforming Biotherapeutics Development: A PAT-Ready Analytical Platform for Biopharma Webinar In this webinar, we will present how Veloci, designed for regulated environments and powered by the innovative A-TEEM™ technology, serves as a powerful PAT-enabling tool for therapeutic protein analysis. Molecular Spectroscopy & Particle Analysis With expertise spanning particle characterization, Raman spectroscopy, and fluorescence spectroscopy, HORIBA technologies enable detailed molecular, structural, and physicochemical analysis across complex biological systems. Contact Us arrow_forward arrow_back Horiba Logo Spincotech Cropped

What is Raman Spectroscopy?

Raman Spectroscopy is a non-destructive chemical analysis technique which provides detailed information about chemical structure, phase and polymorphy, crystallinity and molecular interactions. It is based upon the interaction of light with the chemical bonds within a material.
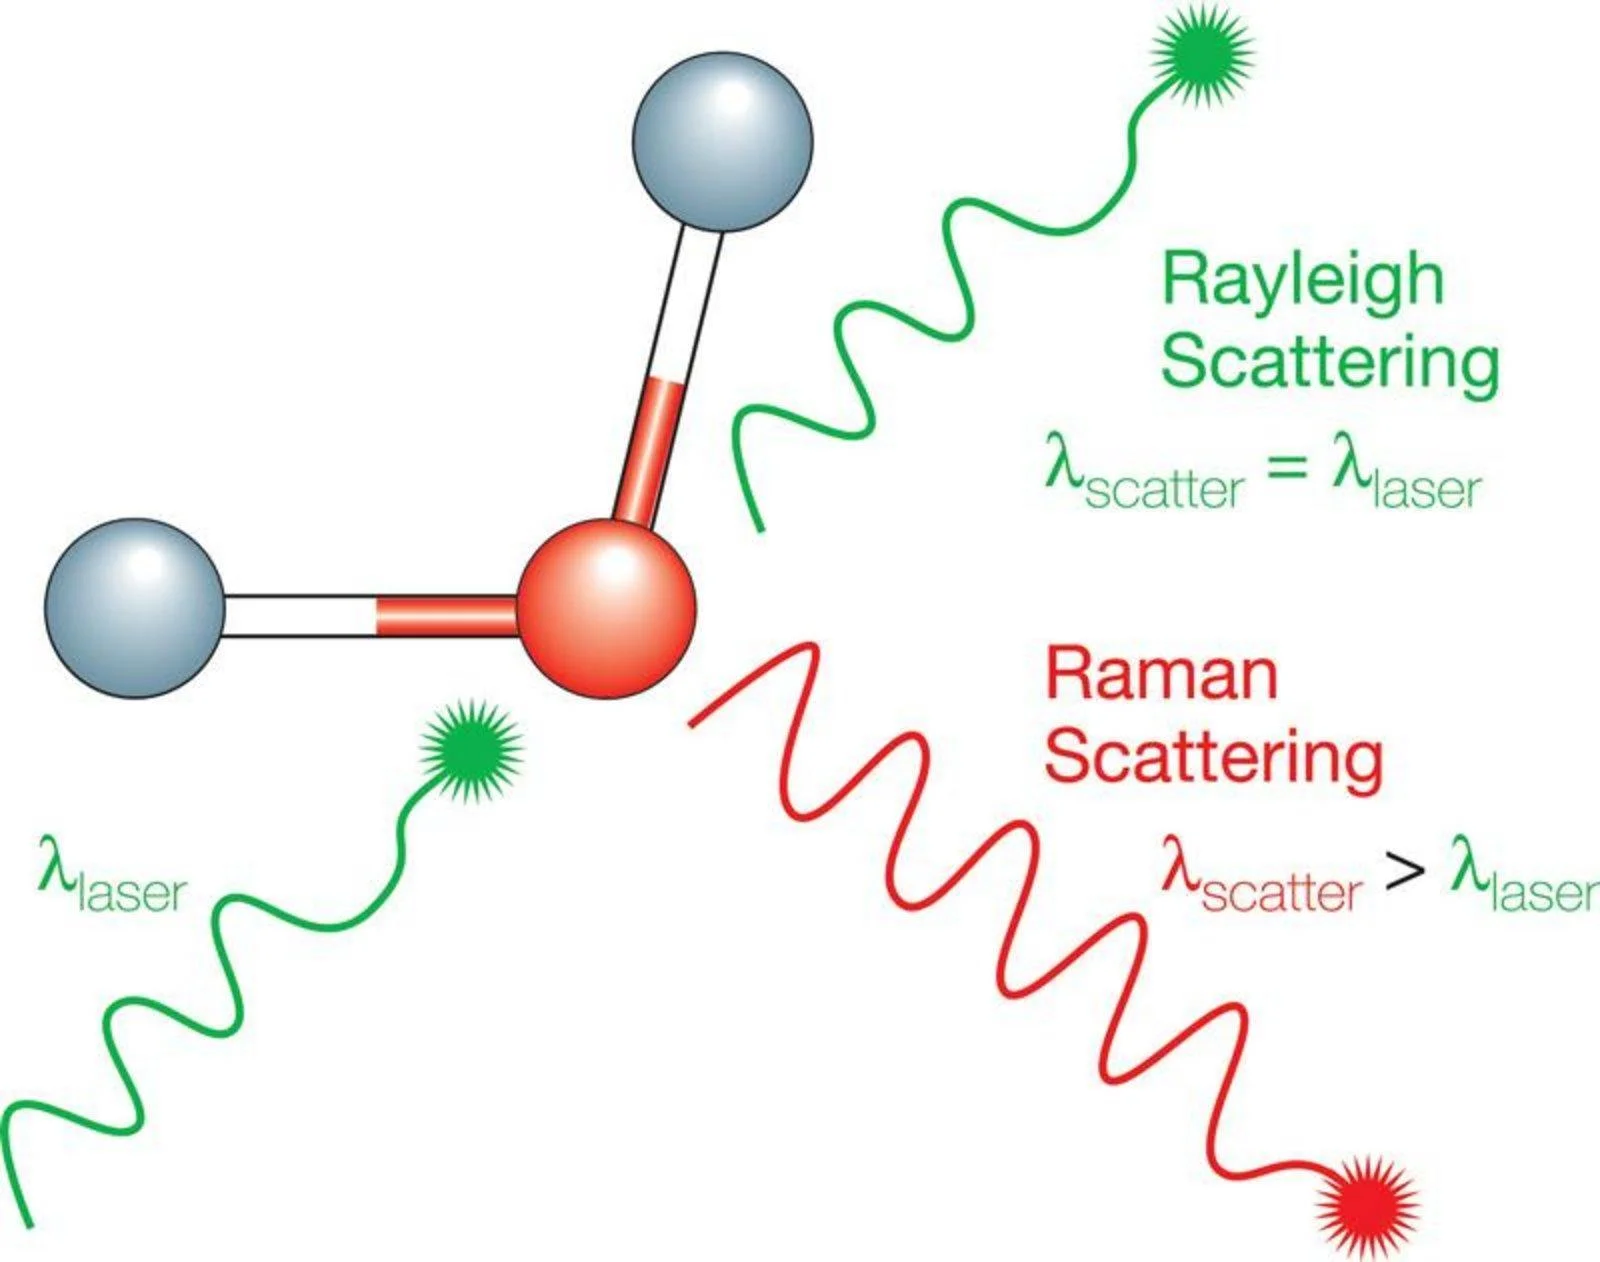
Raman is a light scattering technique, whereby a molecule scatters incident light from a high intensity laser light source. Most of the scattered light is at the same wavelength (or color) as the laser source and does not provide useful information – this is called Rayleigh Scatter. However a small amount of light (typically 0.0000001%) is scattered at different wavelengths (or colors), which depend on the chemical structure of the analyte – this is called Raman Scatter.

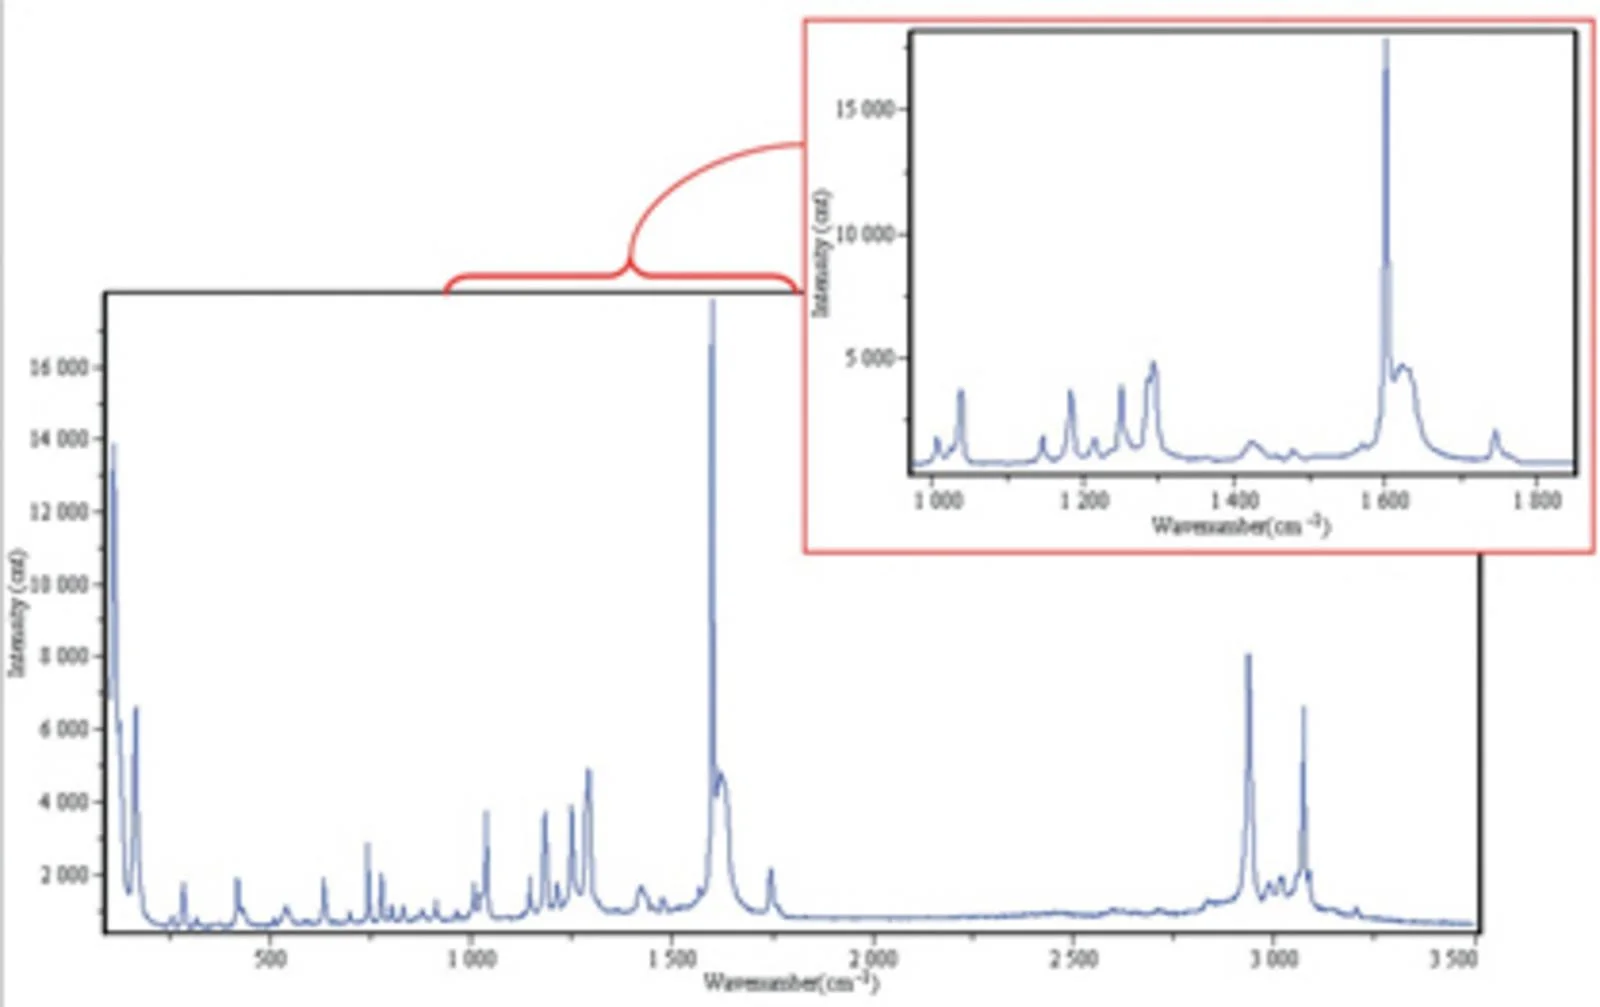
A Raman spectrum features a number of peaks, showing the intensity and wavelength position of the Raman scattered light. Each peak corresponds to a specific molecular bond vibration, including individual bonds such as C-C, C=C, N-O, C-H etc., and groups of bonds such as benzene ring breathing mode, polymer chain vibrations, lattice modes, etc.

What is Raman Spectroscopy Spincotech
Raman Principle
Raman spectrum Spincotech
A typical Raman spectrum, in this case, of aspirin (4-acetylsalicylic acid).
Information provided by Raman spectroscopy Spincotech
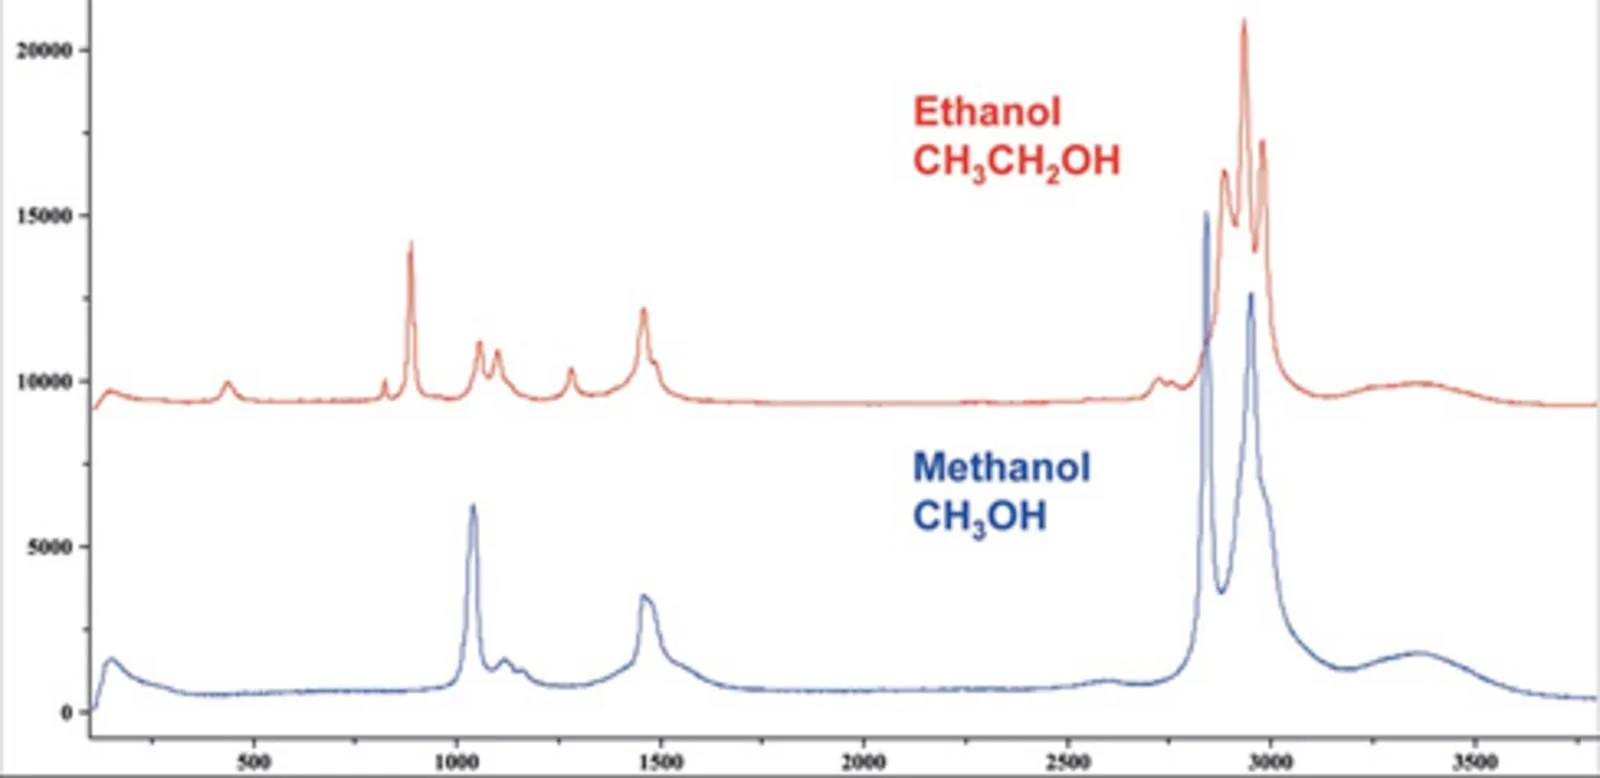
Raman spectra of ethanol and methanol
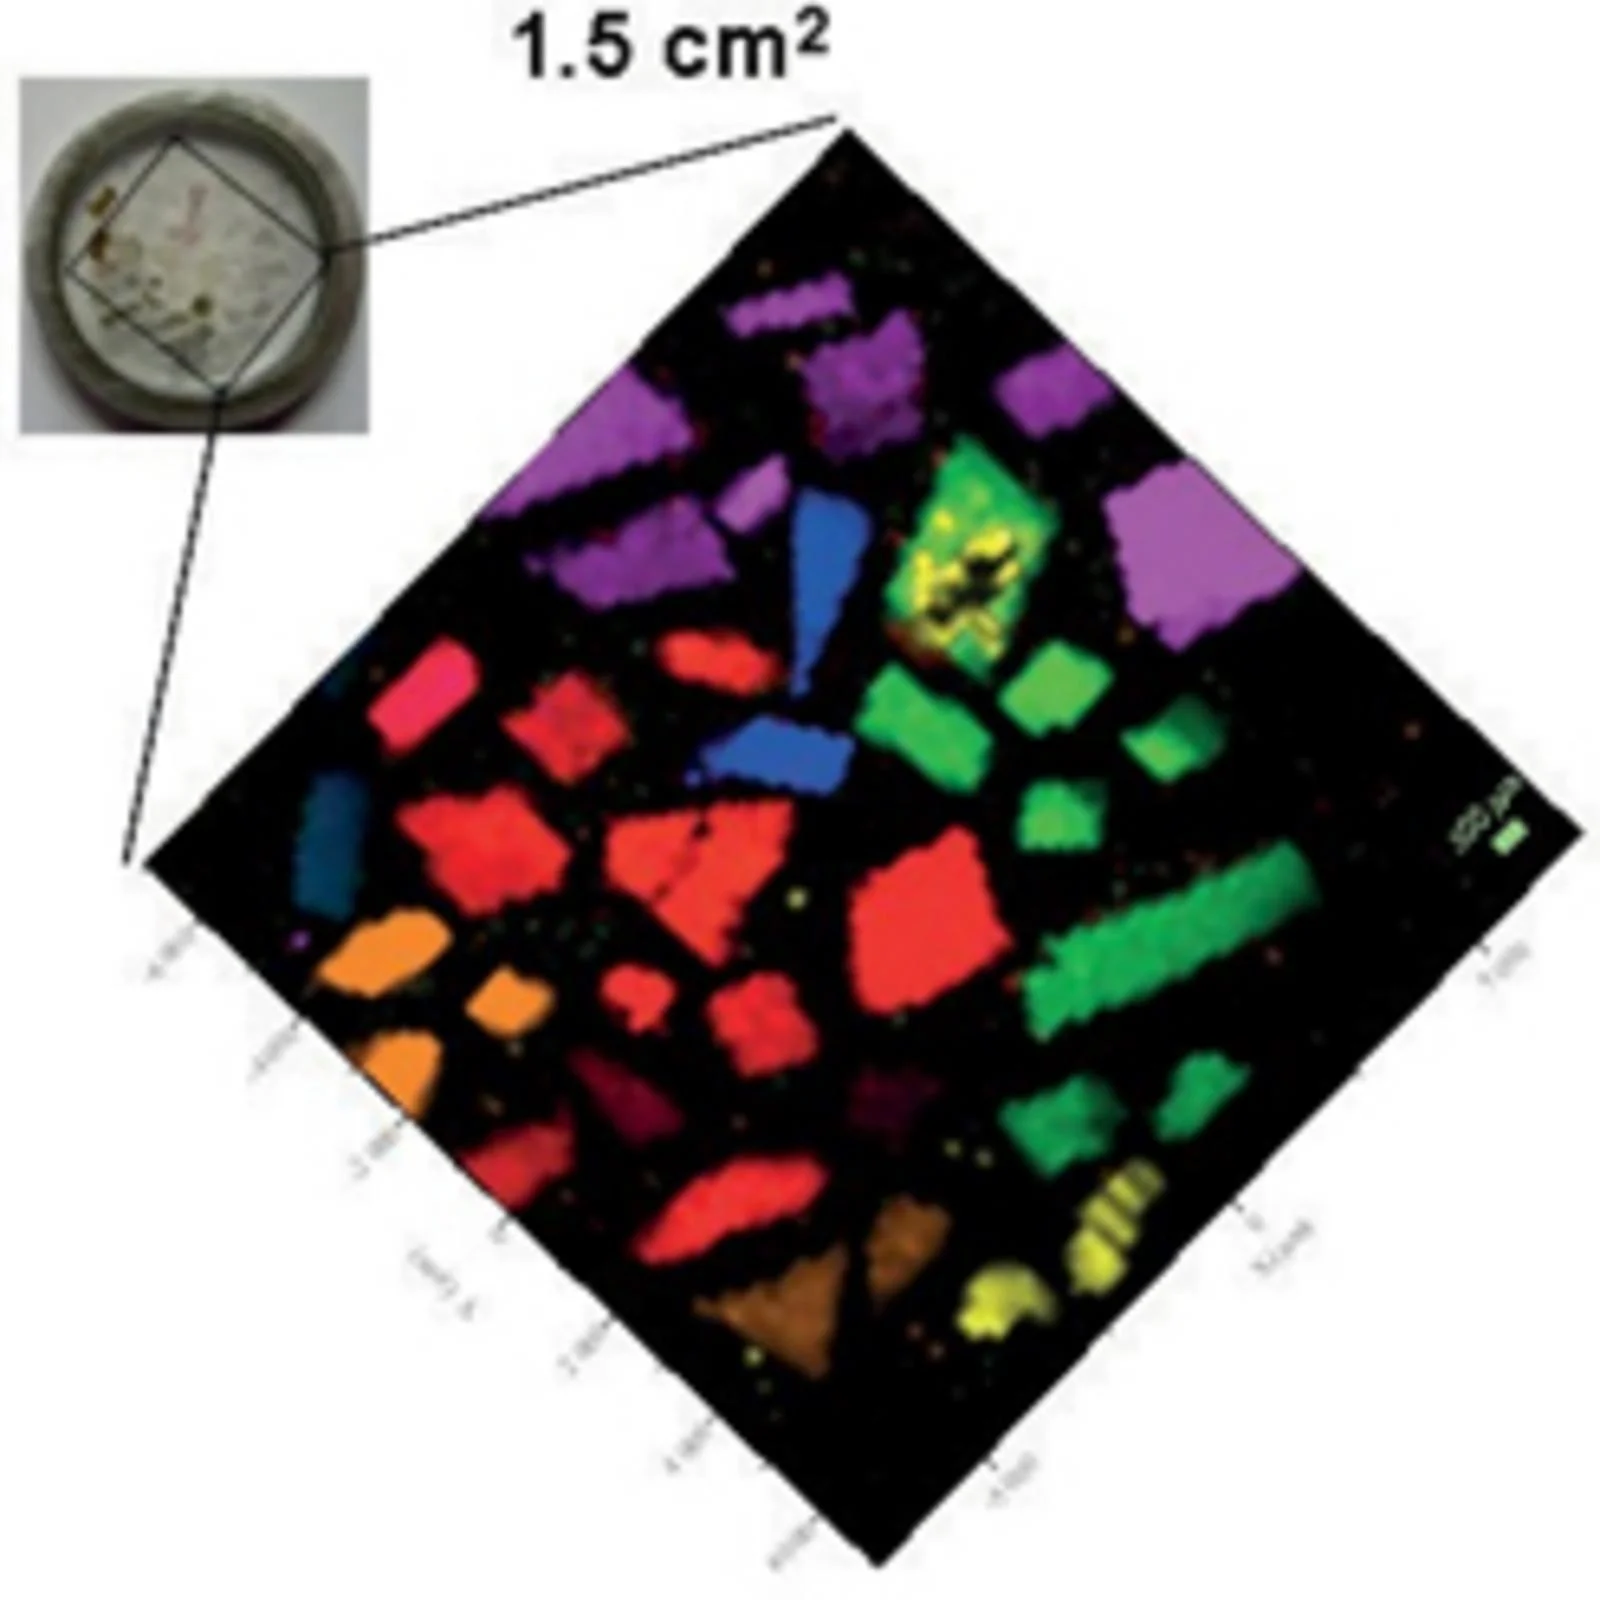
Mineral distribution Spincotech
Mineral Distribution

Information provided by Raman spectroscopy

Raman spectroscopy probes the chemical structure of a material and provides information about:
  1. Chemical structure and identity
  2. Phase and polymorphism
  3. Intrinsic stress/strain
  4. Contamination and impurity
Typically a Raman spectrum is a distinct chemical fingerprint for a particular molecule or material, and can be used to very quickly identify the material, or distinguish it from others. Raman spectral libraries are often used for identification of a material based on its Raman spectrum – libraries containing thousands of spectra are rapidly searched to find a match with the spectrum of the analyte.
In combination with mapping (or imaging) Raman systems, it is possible to generate images based on the sample’s Raman spectrum. These images show distribution of individual chemical components, polymorphs and phases, and variation in crystallinity.

Raman Imaging and Spectrometers

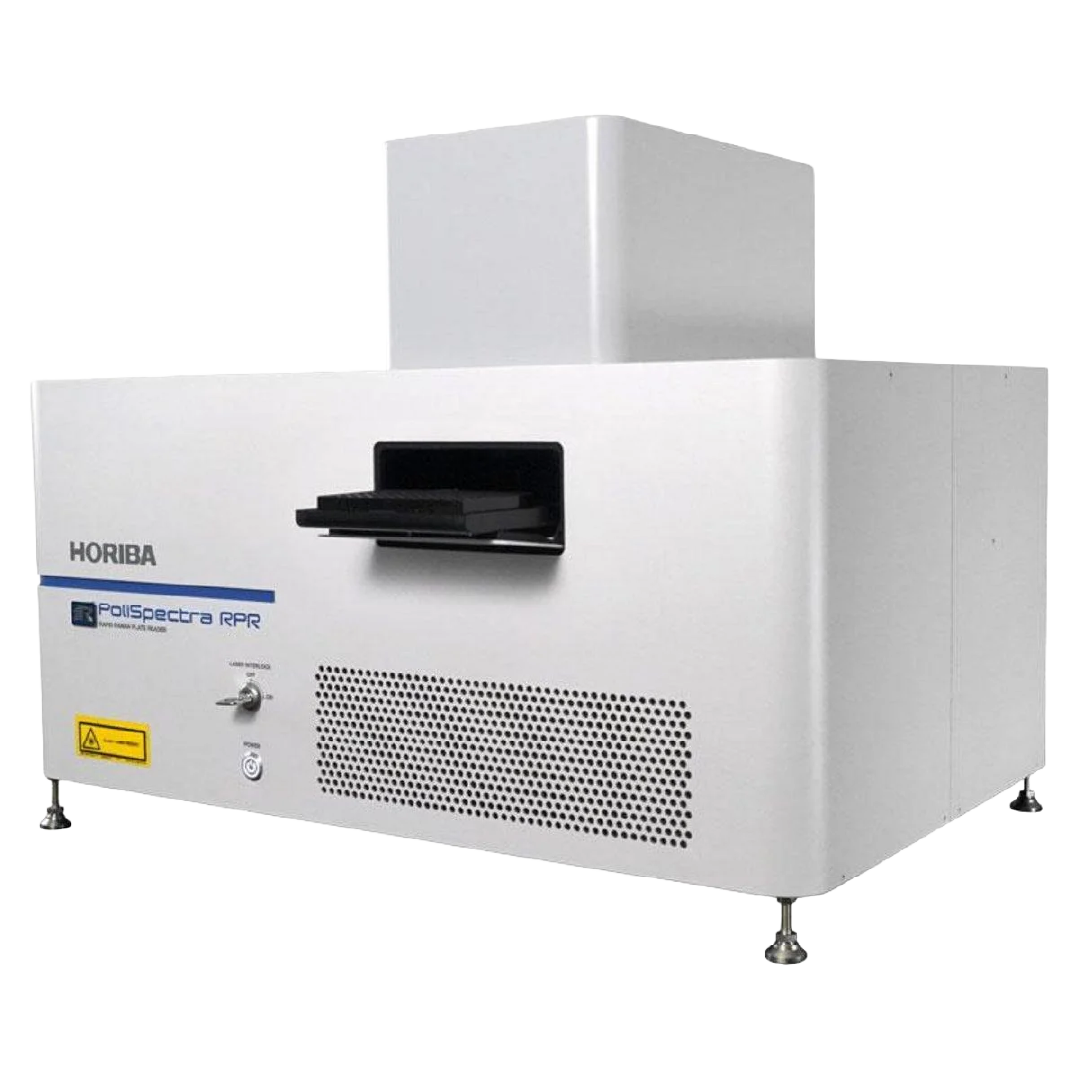
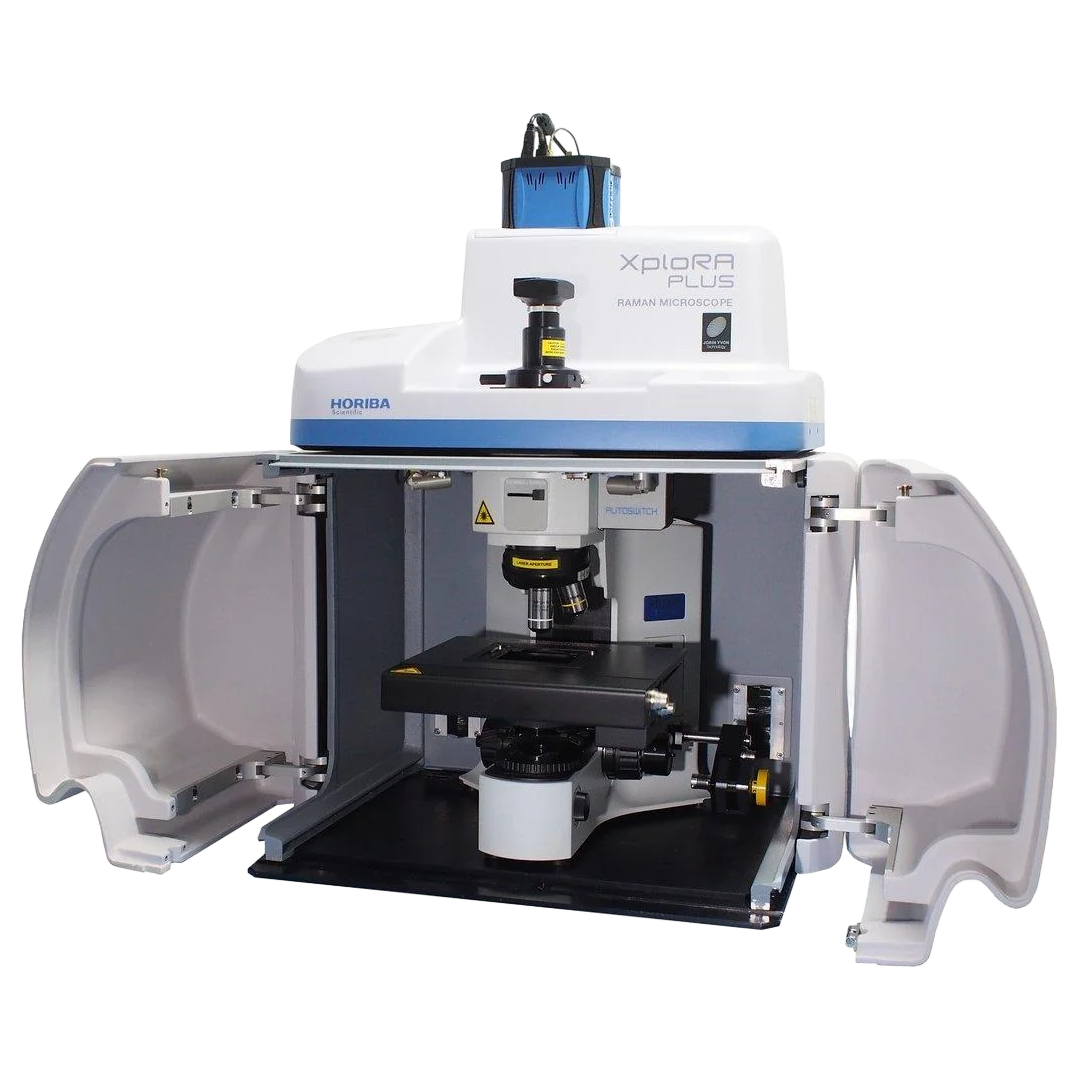
HORIBA Raman spectroscopy solutions provide high-resolution, non-destructive molecular characterization for advanced life science and pharmaceutical research. Raman spectroscopy enables detailed analysis of chemical composition, molecular structure, phase, polymorphy, crystallinity, and molecular interactions through inelastic scattering of light, making it a powerful technique for label-free chemical imaging and molecular fingerprinting.

With decades of innovation in Raman microscopy and imaging, HORIBA technologies support applications ranging from pharmaceutical characterization and biomolecular analysis to single-cell studies, tissue imaging, and live-cell research. Raman imaging enables researchers to obtain both spatial and molecular information simultaneously, supporting detailed investigation of biological systems without the need for labels or dyes.

HORIBA’s Raman portfolio includes advanced Raman microscopes and imaging platforms designed to deliver high spectral resolution, rapid acquisition, and detailed sample characterization across academic, pharmaceutical, and translational research environments.

Image Analysis of Particles

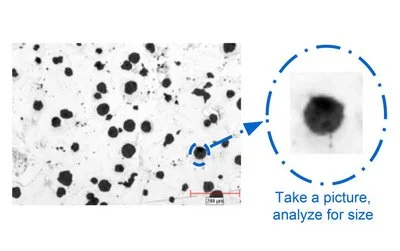
Particle size and shape can be determined with photos of the particles. Since a typical particle sample consists of a range of size and shapes, modern analysis is done with a computer that automatically analyzes particle images to rapidly determine size and shape. Data from a large number of particles can then be summarized into distributions that describe the sample.
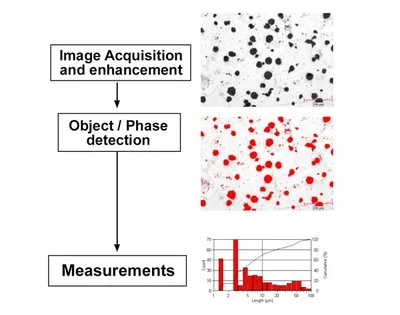
There are three major steps in image analysis: image acquisition and enhancement, object detection, and measurement. The first step, image acquisition is easily phrased as taking a photograph. However, modern analyzers all include features to ensure high quality images with, for example, bright, uniform lighting. The major differences between the image analysis techniques presented here are primarily in the approach to image capture.
Object/phase detection can be simple for well dispersed particles and can be extended to include special lighting and software algorithms to separate touching particles. The final step is computation of the desired parameters for particle size and shape of each particle. This data is build up to generate a distribution from which population statistics can be extracted.
These steps are independent of the imaging method. The sizes that can be measured depend on the wavelength of the radiation used. For the smallest particles, electron microscopes can provide data, at the cost of challenging sample preparation and expensive equipment. For particles that are over about ½ micron in size, visible light (optical microscopy) is preferred.
When using visible light, the particle image analysis can be further broken down into dynamic image analysis, static image analysis, and in-line image analysis. And generally these different techniques primarily represent differences in image acquisition.
Dynamic image analysis refers to a laboratory technique where the particles are passed in front of the camera optics. Static image analysis refers to a laboratory technique where the particles are on a stationary slide. In contrast, in-line image analysis is used directly on a process where the particles are passing by a window on a pipe or piece of process equipment, such as the bottom of a fluidized bed coater.Each technique has advantages and disadvantages and the best technique depends on the application.

Image analysis of particles Spincotech
Image analysis of particles is effectively determining particle physical parameters from pictures.
The major steps for image analysis of particles. First, high quality images are acquired, then the particles (or second phase for an emulsion) are identified. Finally, size and shape parameters are extracted for analysis of the population.

Particle Size Analyzers

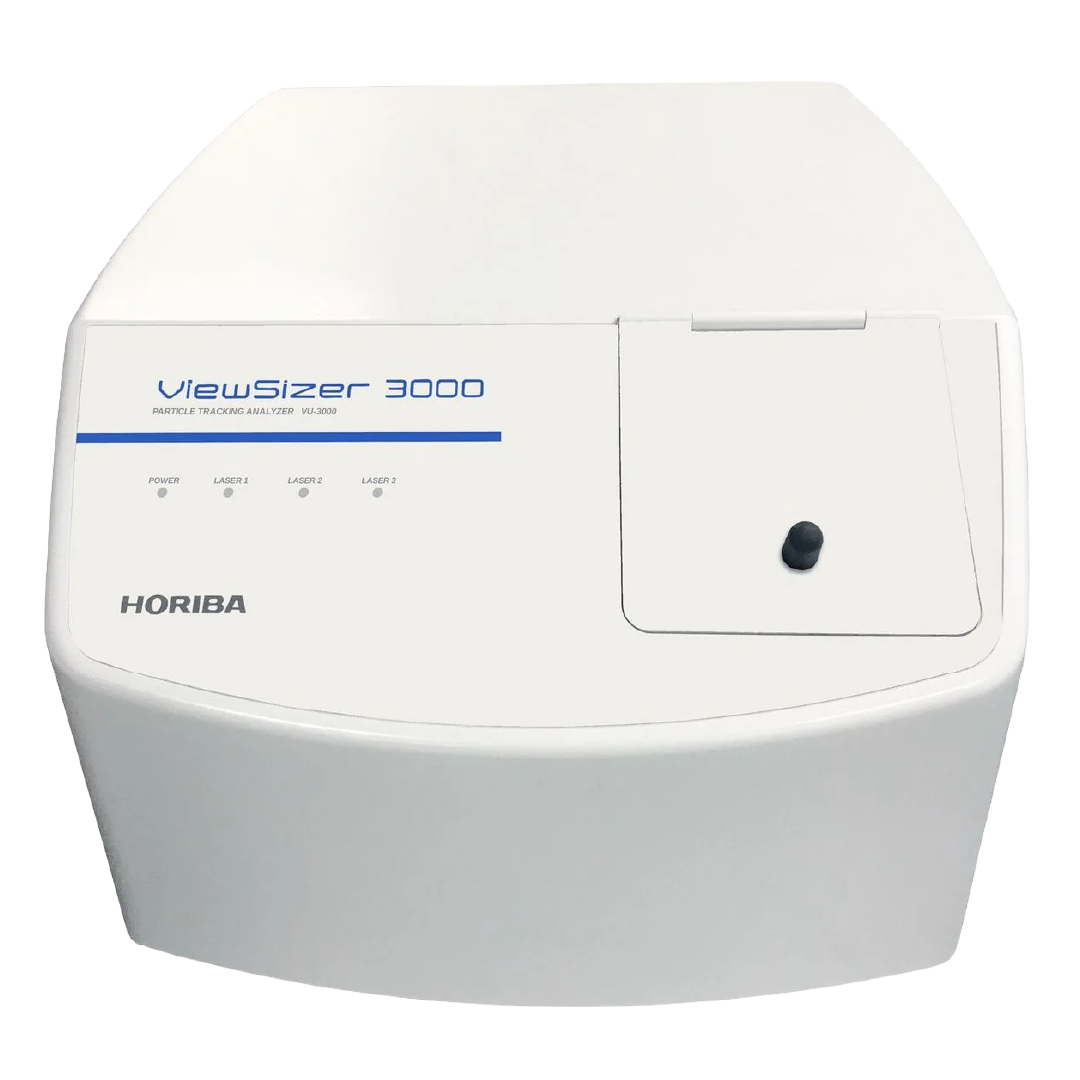
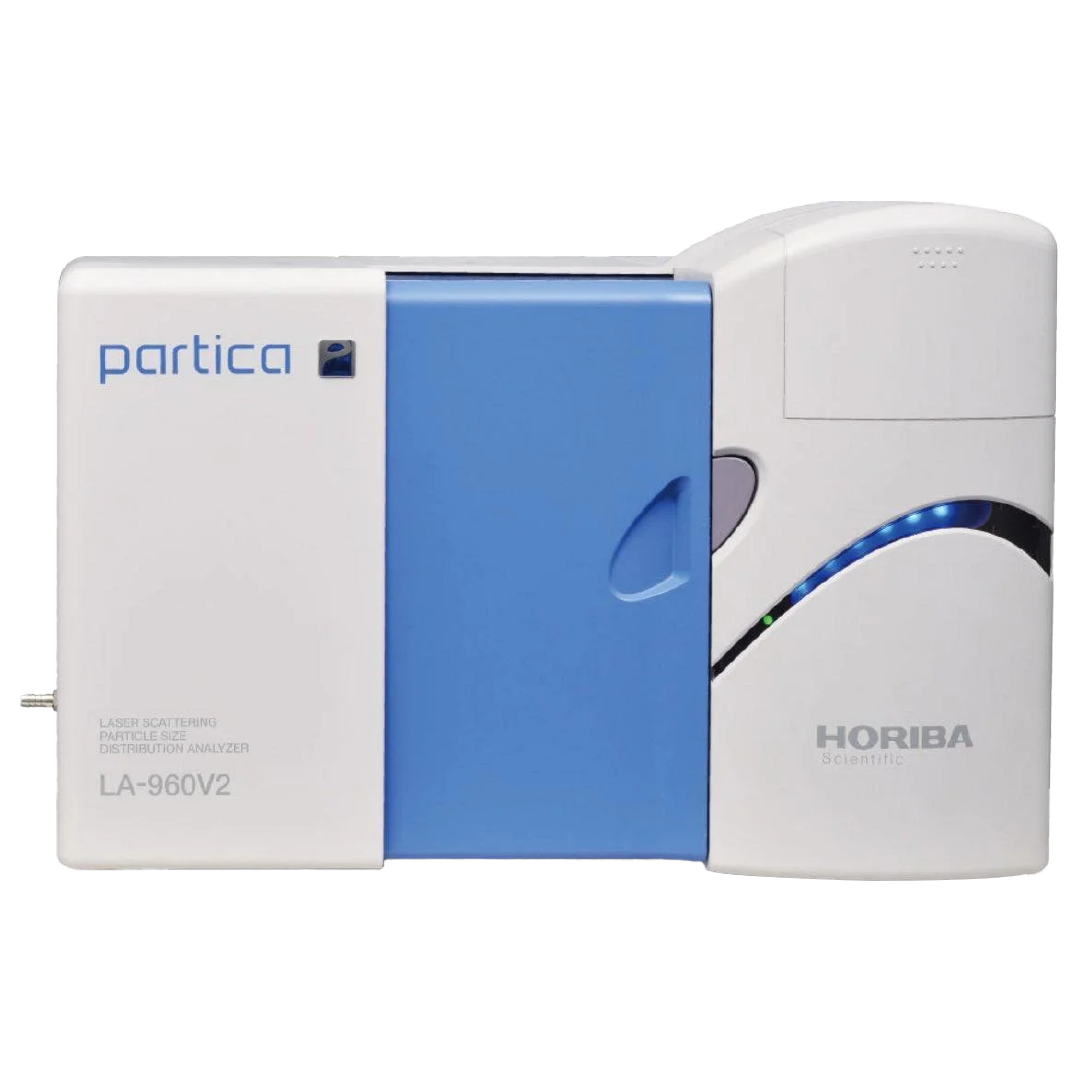
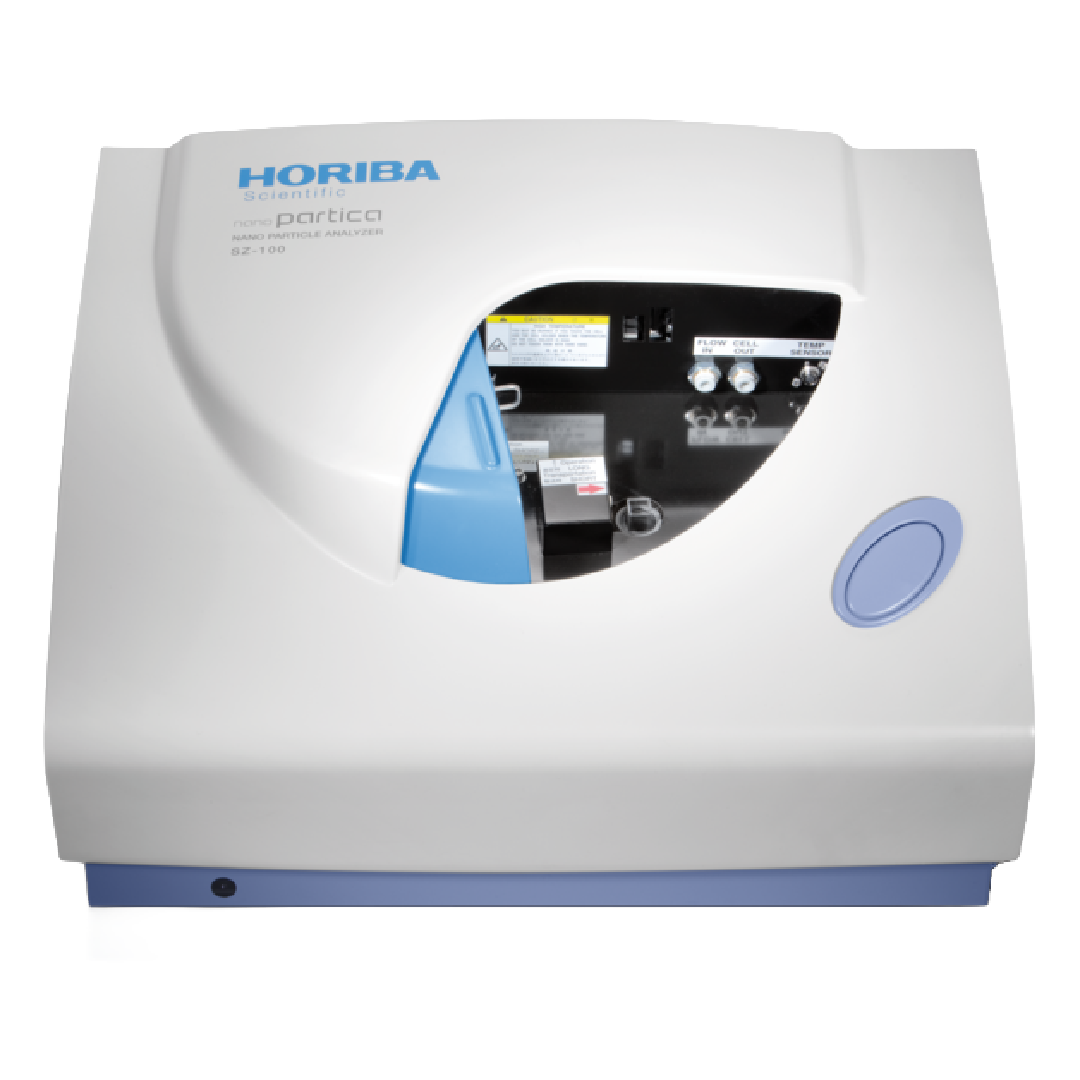
HORIBA designs, manufactures, and supplies state-of-the-art particle characterization instruments that enable precise analysis of particle size, shape, surface charge, concentration, and colloidal stability across biological and pharmaceutical systems. Leveraging technologies including Dynamic Light Scattering (DLS), Nanoparticle Tracking Analysis (NTA), laser diffraction, zeta potential analysis, and dynamic imaging, HORIBA platforms support comprehensive characterization of nano- and micro-scale materials used in life science and biopharmaceutical research.

Particle analysis plays a critical role in modern pharmaceutical and life science workflows, particularly in the characterization of lipid nanoparticles (LNPs), extracellular vesicles, biologics formulations, protein aggregates, and advanced drug delivery systems. HORIBA technologies help researchers better understand particle distribution, stability, morphology, and formulation behavior to support product development, quality assessment, and translational research applications.

What is Fluorescence Spectroscopy?

Fluorescence spectroscopy is an investigative method based on the fluorescence properties of the sample under study, and is used for quantitative measurements of chemical products. Fluorescence spectroscopy analyzes fluorescence from a molecule based on its fluorescent properties. Fluorescence is a type of luminescence caused by photons exciting a molecule, raising it to an electronic excited state. Fluorescence spectroscopy uses a beam of light that excites the electrons in molecules of certain compounds, and causes them to emit light. That light is directed towards a filter and onto a detector for measurement and identification of the molecule or changes in the molecule.
Fluorescence Spectrum Spincotech
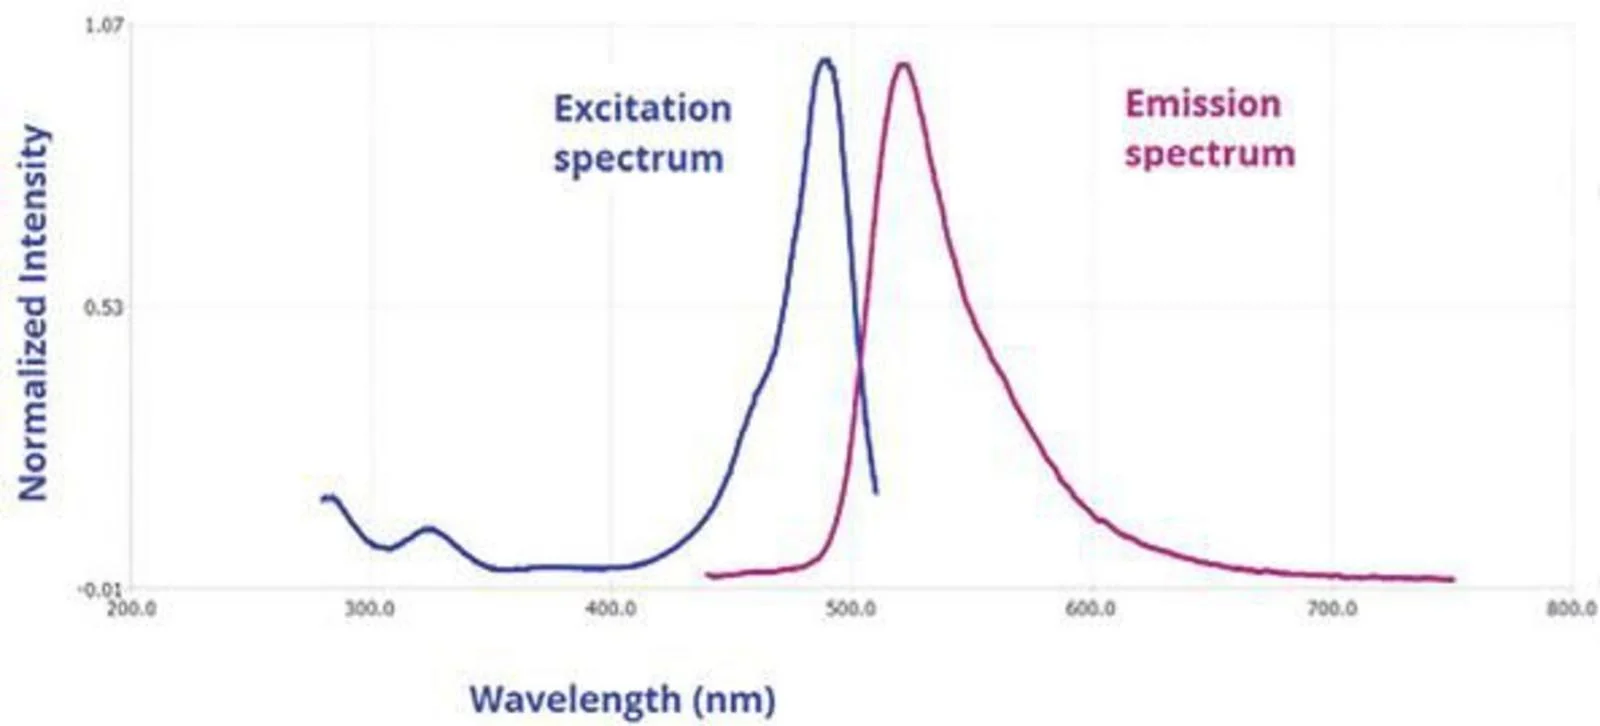
The emission and excitation spectra for a given fluorophore are mirror images of each other

What is a Fluorescence Spectrum?

Steady state fluorescence spectra are when molecules, excited by a constant source of light, emit fluorescence, and the emitted photons, or intensity, are detected as a function of wavelength. A fluorescence emission spectrum is when the excitation wavelength is fixed and the emission wavelength is scanned to get a plot of intensity vs. emission wavelength.
A fluorescence excitation spectrum is when the emission wavelength is fixed and the excitation monochromator wavelength is scanned. In this way, the spectrum gives information about the wavelengths at which a sample will absorb so as to emit at the single emission wavelength chosen for observation. It is analogous to absorbance spectrum, but is a much more sensitive technique in terms of limits of detection and molecular specificity. Excitation spectra are specific to a single emitting wavelength/species as opposed to an absorbance spectrum, which measures all absorbing species in a solution or sample. The emission and excitation spectra for a given fluorophore are mirror images of each other. Typically, the emission spectrum occurs at higher wavelengths (lower energy) than the excitation or absorbance spectrum
These two spectral types (emission and excitation) are used to see how a sample is changing. The spectral intensity and or peak wavelength may change with variants such as temperature, concentration, or interactions with other molecules around it. This includes quencher molecules and molecules or materials that involve energy transfer. Some fluorophores are also sensitive to solvent environment properties such as pH, polarity, and certain ion concentrations.

What types of molecules and materials exhibit fluorescence?

Fluorescent molecules and materials come in all shapes and sizes. Some are intrinsically fluorescent, such as chlorophyll and the amino acid residue tryptophan (Trp), phenylalanine (Phe) and tyrosine (Tyr). Others are molecules synthesized specifically as stable organic dyes or tags to be added to otherwise non-fluorescent systems. There are entire catalogs of these available. Typically, organic fluorescent molecules have aromatic rings and pi-conjugated electrons in them. Depending on their size and structure, organic dyes can emit from the UV out into the near-IR.
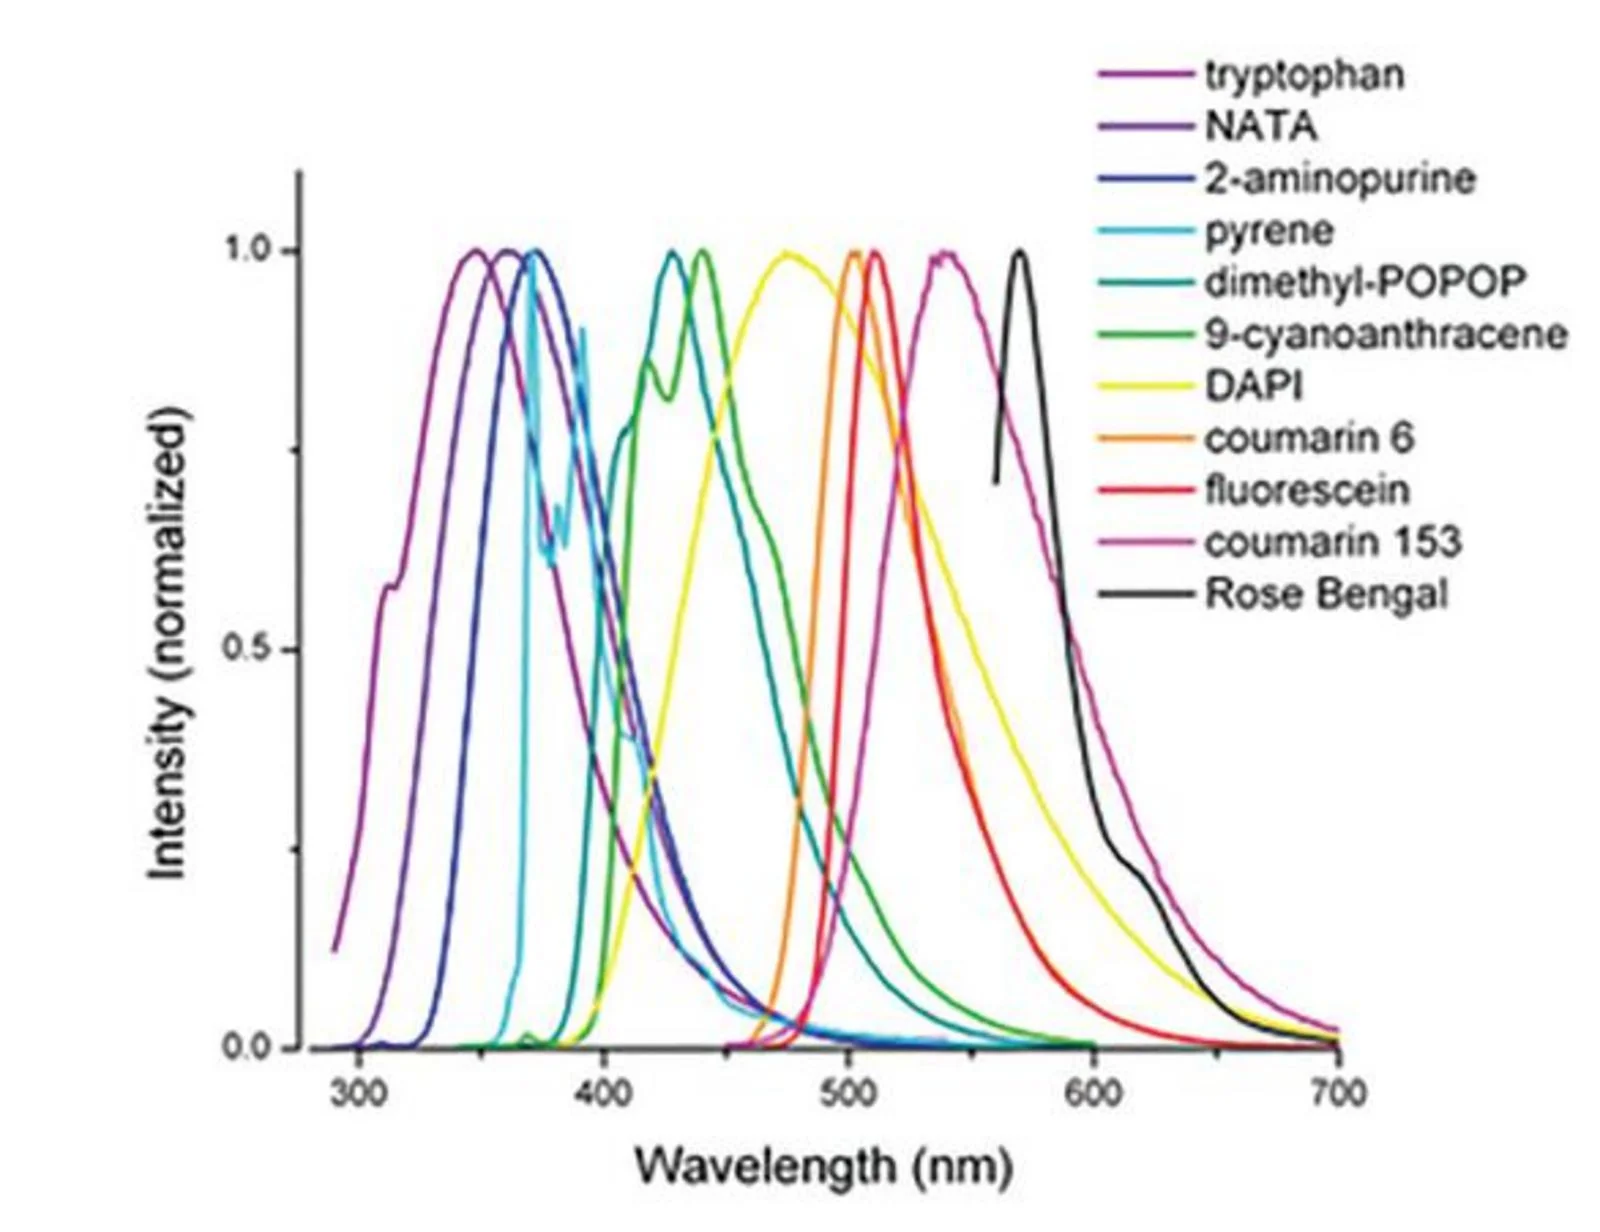
Here are a random sampling of a few common fluorophores that span the UV and Visible range. Some rare earth elements, or lanthanides, have higher electronic orbitals filled, where electrons transition due to metal ligand charge transfers happen between 4f-5d and even 4f-4f orbitals. (Bunzli, 1989) There are many molecules that are luminescent in nature such as a few of the amino acids, chlorophylls, and natural pigments. Others are highly engineered for very specific uses of fluorescence spectroscopy.
materials exhibit fluorescence Spincotech
Fluorescence emission spectra of some common fluorophores across the UV and visible spectrum.

Fluorescence Spectroscopy

HORIBA fluorescence spectroscopy solutions deliver highly sensitive biomolecular analysis for life science, pharmaceutical, and biologics research applications. Designed for detailed molecular and fluorescence-based characterization, these technologies support protein analysis, biomolecular interaction studies, fluorescence fingerprinting, kinetic analysis, and advanced spectroscopic workflows across research and development environments.
A key innovation within HORIBA’s fluorescence portfolio is A-TEEM™ spectroscopy — simultaneous Absorbance, Transmittance, and Fluorescence Excitation-Emission Matrix (EEM) acquisition. This proprietary technology combines the speed and simplicity of molecular spectroscopy with the sensitivity and selectivity traditionally associated with chromatographic techniques.
A-TEEM technology enables simultaneous acquisition of absorbance, transmittance, and fluorescence EEM data while correcting for inner filter effects in real time, supporting rapid and highly sensitive molecular fingerprinting workflows. HORIBA pioneered this technology through platforms such as Aqualog® and Duetta®, enabling fast, reproducible, and information-rich fluorescence analysis.
The technology is particularly valuable for biotechnology and biopharmaceutical applications involving complex biomolecular systems, biologics characterization, fluorescence-based profiling, and molecular interaction studies.

What you can expect

Biopharma and Pharmaceutical Spincotech
Biopharma and Pharmaceutical

From protein secondary structure analysis with Raman; to rapid infectious titer determination with simultaneous multi-laser NanoTracking Analysis; to AAV characterization and vaccine batch

Biotechnology and Biomedical Spincotech
Biotechnology and Biomedical

From CRISP-Cas9 to Extracellular vesicles, mRNA technology to cell and gene therapies, these advances push the limits of performance and create the requirement for parallel innovations

Cosmetics Spincotech
Cosmetics

From particle size characterization of emulsions, pigments or fillers, through the molecular analysis of hair chemistry, surface functionalization or tribology, to the assessment of formulation stability

Food and Beverage Spincotech
Food and Beverage

As the food supply chain has become increasingly global, there is a growing focus on the safety and integrity of food and beverage products, agricultural crops, and other natural products such as oils

our expertise

Horiba's Mission

Through genuine partnership with our customers, in the Life Science industry, HORIBA will develop and deliver, innovative analytical and automation solutions, combining state-of-the-art, optical, electrochemical, and X-ray technologies, with core competencies in sampling, engineering and data science. HORIBA will contribute to breakthroughs in drug development and manufacturing, leading to the adoption of new technologies, and contributing to a healthier, more affordable and more equitable health care for all.

0 +

Years of Raman Spectroscopy Innovation

0 +

Years of Innovation