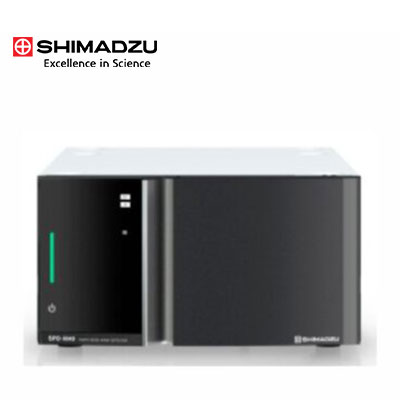
Photodiode Array Detector
Boost your high sensitivity measurements over a wide wavelength range. The SPD-M40 has great accuracy in identification of compounds from absorbance spectra and performs an impurity check on all peaks. The industry leading i-PDeA deconvolution algorithm spectrally resolves coeluting peaks. The newly designed optical system guarantees both a wide linearity range and a superb signal-to-noise ratio performance at the same time. It has improved stability in analysis through flow cell/polychromator/lamp compartment temperature control. Each SPD-M40 is equipped with a UV cutoff filter, which allows even less variation and more robust analysis by minimizing sample decomposition.
- Wavelength range of 190 nm – 800 nm, wavelength accuracy ± 1 nm, noise level of 4.5 x 10⁻⁶ AU, and drift less than 0.4 x 10⁻³ AU/hour.
- Contains both a deuterium (D2) and tungsten (W) lamp.
- UV cut-off filter that removes wavelengths below 240 nm from entering the flow cell.
- Has a 1024 element diode array. Fully temperature-controlled optics, including the optical bench, lamp housing, and flow cell. Monitored and controlled with a standard web browser.
- Built-in Cell ID that is automatically recorded in analysis data.
- Linear up to 2.5 AU (ASTM method). Pressure tolerance of 12 MPa.
- Automatic wavelength accuracy check and wavelength correction.
- Integrated 4 channel analog output.
- Optional flow cells that can be changed by the user: UHPLC, semi-micro, inert, preparative and high-pressure cell.
- Capable of using the i-PDeA II deconvolution algorithm to resolve co-eluting peaks.
Intelligent Peak Deconvolution Analysis (i-PDeA)
Intelligent Peak Deconvolution Analysis (i-PDeA) is a data analysis technique that extracts a single peak from co-eluted peaks and quantitates it by exploiting the differences in spectra between each compound. i-PDeA II enables users to visualize and detect a minor single impurity even when the impurity is co-eluted with an analyte. It also facilitates the separation of hard-to-separate peaks on the column through computer processing and deconvolution of the spectrum information, which reduces the effort required to investigate separation parameters.
Using i-PDeA II to reduce analysis time
When you apply i-PDeA, you can selectively visualize only the components you want to view, even peaks that are not separated!

Separation of Position Isomer Compounds
Even though the difference in absorption wavelength between 1,2-dimethoxybenzene (274.2 nm wavelength) and 1,3-dimethoxybenzene (273.6 nm) is only 0.6 nm, the individual chromatograms can be obtained!


