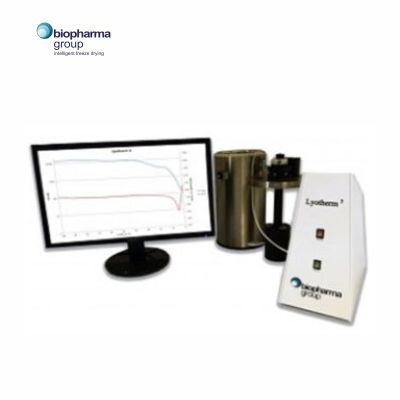
Lyotherm 3 Freeze Drying Impedometer
The Lyotherm 3 is a unique combination of an emerging analytical technique, impedance analysis, combined with traditional differential thermal analysis (DTA). These techniques use two different perspectives to enhance the analysis data providing an extra dimension to the information allowing for greater detail and more informed decision making.The new Lyotherm 3 has been developed specifically to meet the analysis challenges that those working with analytical data for frozen state solutions encounter including the need for a higher impedance ceiling for early transitions in particular
ElectricalImpedance: Impedance combines capacitance, inductance and resistance into one metric that relates to molecular mobility within the sample. This identifies softening, stabilization, crystallization, glass transitions, melting and other phase changes.
DTA: Identifies the thermal signature of events by comparing the temperature of the sample to a reference. Identification of exo/endotherms, glass transitions and melting events gathers more information on the events seen with impedance.
One of the major advantages of the Lyotherm 3 is the increased sensitivity to minor reorientations and thus glass transitions.The Lyotherm 3 often finds the same, or more, events in complex solutions, and often identifies more information to give a better profile of those events than can be seen in mDSC due to the collaboration of electrical and thermal techniques.
Features & Benefits of using the Lyotherm 3:
- Determines critical parameters of samples within the frozen state (Tg’, Crystal Transitions, Teu, Softening)
- Identifies viscosity changes within the frozen structure
- Optimised for frozen state analysis
- Typical analysis time: 1 hour
- Alarms and liquid nitrogen precision allow greater control over analysis
- Updated control unit and wiring design reducing benchtop footprint
- Simplified operation to increase reliability of results
- Most accurate analysis data available on the market
- Clear graph data and flexibility during post-analysis
- Simple data processing – exporting to Excel tailors the graph to the analysis
- On-site installation includes full training into operation and interpretation of results


